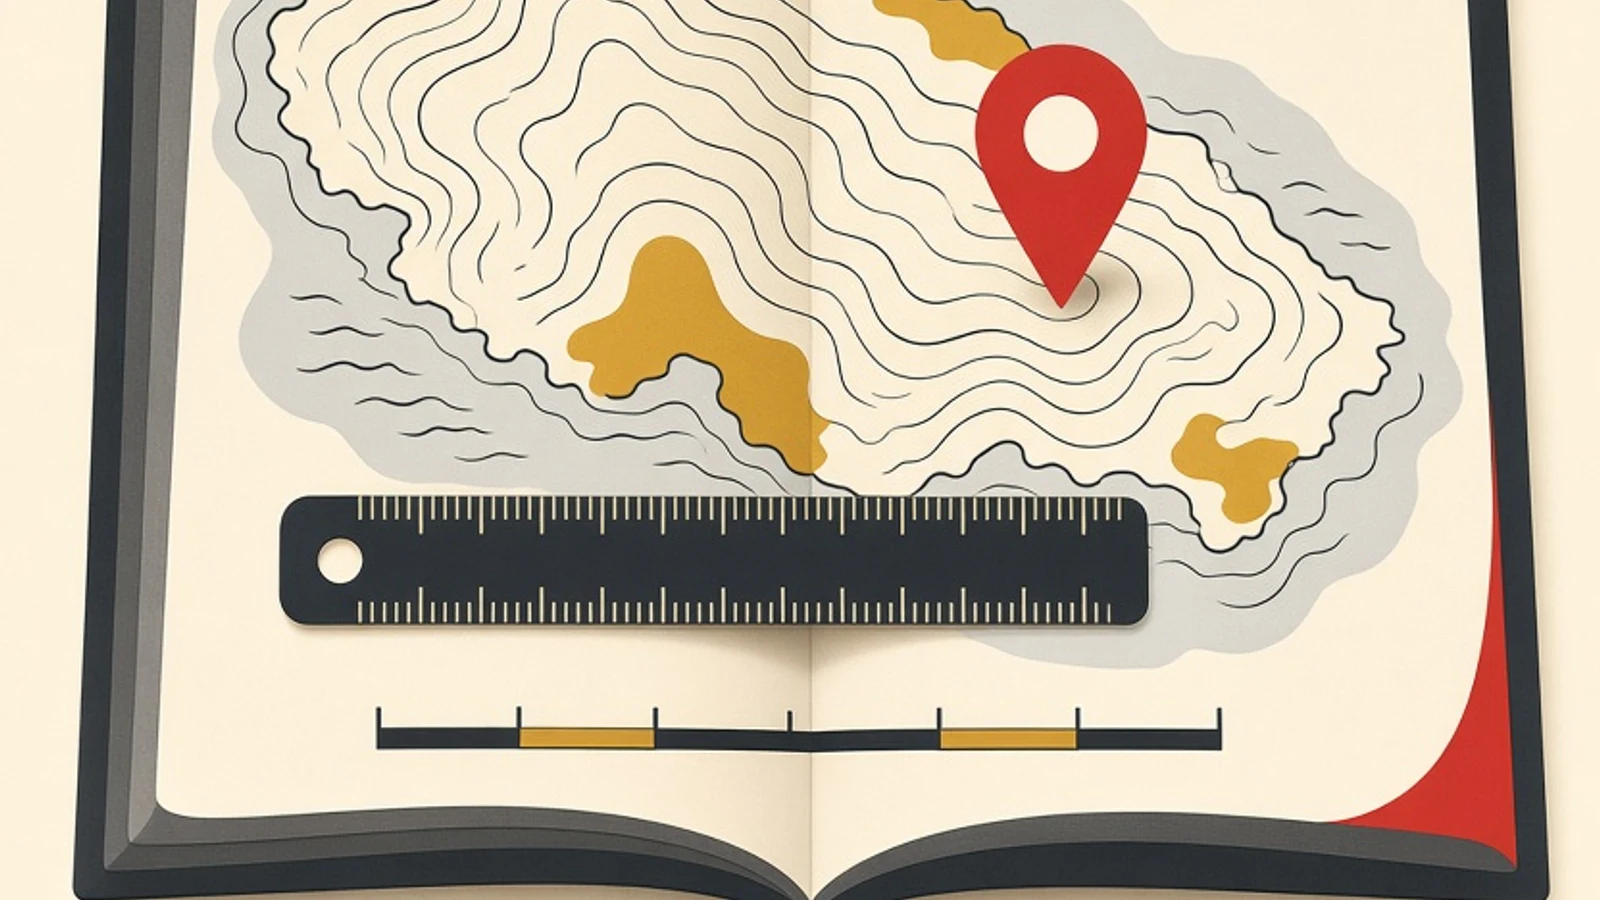
Reading a map gets easier with a fixed order of five steps: read the title, understand the scale, match symbols to the legend, find north, and then pin down the location with latitude and longitude. The payoff is measurable. On a 1:50,000 map, a line 4 cm long stands for 2 km on the ground.
- The map components follow Indonesia's 2021 Grade 7 social studies textbook from the national curriculum and textbook centre.
- Practice uses two easy-to-find materials: a printed atlas and a digital map of the learner's own neighbourhood.
- The goal is one concrete skill: working out real distance from scale and then checking it on a digital map.
- A printed atlas, the learner's own or one borrowed from the school library
- A 30 cm ruler with clear centimetre markings
- A notebook for titles, scales and worked answers
- A pencil and eraser for marking directions and points on the map
AMap components to know first
A map is a reduced picture of the earth's surface drawn on a flat plane at a set scale. The science of making maps is called cartography, and the people who make them are cartographers. An atlas is a book or collection of maps. The word was first used for a collection of maps by Gerardus Mercator, a Flemish cartographer, in 1595, and it comes from Atlas, a king in myth. Today there are world atlases, road atlases, historical atlases and even star atlases. Indonesia's Grade 7 social studies textbook (Pusat Kurikulum dan Perbukuan, 2021) lists the components of a map as the title, scale, symbols, colours, legend, orientation or compass rose, and the source and year of production. The material sits in Theme 01, in the section on understanding location through maps, so Grade 7 students usually meet it early in the school year. The book also asks students to identify these components in groups using a map of Bantul Regency. The textbook supplies the list. This guide adds a reading order. The title comes first so the reader knows which area and which theme are on the page. The scale follows, showing how much that area has been shrunk. The legend comes third, giving every symbol and colour a fixed meaning. The compass rose comes fourth so directions stay straight. Latitude and longitude come last, because by then a place can be stated as a pair of numbers. Each answer feeds the step after it. In Indonesia the base map for land areas is the Peta Rupabumi Indonesia (RBI), the national topographic map. Law No. 4 of 2011 on Geospatial Information lists what a base map contains, including coastlines, hypsography or elevation, water bodies, place names, administrative boundaries, transport and utilities, buildings and public facilities, and land cover. A school atlas shows the same elements in a simpler form. The same law names two other base maps, one for coastal areas and one for national waters. The national base maps are produced by the Geospatial Information Agency (Badan Informasi Geospasial, BIG), and official maps can be browsed through the Ina-Geoportal at tanahair.indonesia.go.id. The agency's name is worth remembering for exam questions about official map sources in Indonesia. This guide is written for upper primary and junior high students learning maps in social studies, and for adult learners who want to read maps with confidence when travelling, doing fieldwork or following news about a region. Two materials are enough: a printed atlas and a map app on a phone.
How to read a map in five ordered steps
Work through all five steps on a single map, such as the page for your home province in an atlas. Once that feels smooth, repeat them on a digital map of the streets around home. Each step answers one question, and that answer gets used again in the following step.
Read the title, then the source and year
The title is the map's identity. It tells you which area is shown and often the theme as well: an administrative map of a province, a rainfall map or a population distribution map. It usually sits at the top centre. Reading the title first prevents a mistake that turns up often in social studies questions, which is answering a question about a themed map with general knowledge about the region. A rainfall map of East Java, for example, cannot answer where a regency capital lies, even though the area is the same. After the title, look for the source and year of production. This line is printed small, yet it decides how far the map can still be trusted. The clearest example is the count of Indonesian islands. The Geospatial Information Agency recorded 16,771 named islands with coordinates in 2020, then 17,024 in 2022, 17,374 in 2023 and 17,380 in 2024. An atlas printed a few years ago may still carry an older figure. Province names and numbers also change over time, so an old atlas can show names that are no longer in use. The exercise is simple. Open three atlas pages, write each title as one sentence in your own words, and note the atlas's publication year from its first pages. Digital maps are usually refreshed more often than printed atlases, so each fills gaps in the other. A common slip at this step is skipping the title because the picture seems obvious. Two maps with identical island outlines can show completely different things, such as soil types and population density. A one-sentence summary of the title keeps an answer on theme.
- If the title names a theme (rainfall, population, soil type), jot that theme in the margin before looking at the map itself.
- In an exam, underline the place name in the title so the answer does not drift to a neighbouring area.
Understand the scale and tell large scale from small scale
Scale is the ratio between a distance on the map and the real distance. Indonesia's Law No. 4 of 2011 defines it as the number comparing a distance in geospatial information with the actual distance on the earth's surface. Scale comes in three forms. A numeric scale is a ratio such as 1:100,000, meaning 1 cm on the map equals 100,000 cm, or 1 km, on the ground. A verbal scale uses words, for example one inch to four miles. A graphic scale is a ruled bar labelled with distances. The terms large scale and small scale are easy to mix up. A large-scale map shows a small area in detail, for instance 1:10,000, where individual streets are visible. A small-scale map shows a wide area with less detail, such as 1:1,000,000 or a world map. The rule of thumb: the smaller the denominator, the larger the scale and the more detail. The same law lists scales for the Peta Rupabumi Indonesia running from 1:1,000,000 down to 1:1,000. The graphic scale has a practical advantage. When a map is enlarged on a photocopier or zoomed on a screen, the bar grows with it, so the ratio stays correct. A printed numeric scale does not adjust. That is why phone map apps use a scale bar that changes as you zoom. Before calculating anything, convert every measurement to centimetres. Most scale errors in Grade 7 come from a unit left behind, such as multiplying centimetres and writing the result straight down as kilometres. A quick self-test: on a 1:100,000 map, a 3 cm stretch of road is 300,000 cm or 3 km, while on a 1:1,000,000 map the same length is 30 km.
- Memorise two conversions: 1 km = 100,000 cm and 1 m = 100 cm.
- To keep the direction straight, compare two scales side by side: 1:25,000 shows more detail than 1:250,000.
Match symbols and colours to the legend
The legend explains the symbols used on the map. It usually sits at the bottom, on the left or right. Reading it before exploring the map gives every dot, line and shaded patch a definite meaning. Map symbols come in three kinds. Point symbols mark a single location, such as a regency capital. Line symbols mark something long and narrow, such as a river or a railway. Area symbols mark a wide surface, such as a lake or a swamp. Colours follow fairly steady conventions too: blue for water, green for forest and lowland, yellow for desert, highland or dry vegetation, brown for hills and contour lines, red for volcanoes, towns or main roads, and black for boundaries. Of all the symbols, only contour lines carry height as a number, and the easiest way into them starts at the edge of the map. That is usually where the contour interval is printed, meaning the height difference between two neighbouring lines. Take a 1:50,000 map with a 25 m interval. Count the lines crossed between two points, multiply by 25, and you have the height difference. Then measure the distance between the points with a ruler and convert it with the scale. Four lines crossed within 1 cm means the ground climbs 100 m over 500 m. The same four lines spread across 4 cm means that 100 m climb is shared out over 2 km. The verdict on slope falls out of those two sums: the tighter the spacing, the steeper the terrain. Thicker lines labelled with a height serve as anchors, so you never confuse uphill with downhill. A useful drill for this step: choose one atlas page, cover the legend with a sheet of paper, guess the meaning of five symbols, then uncover the legend and check. Any symbol you guessed wrong is one to review. Then do the same on a digital map by naming the icons that appear around your home, such as a school, a place of worship, a clinic or a bus stop. A frequent error here is treating every blue line as a river. Depending on the legend, a blue line can also mark an irrigation channel, a canal or a shoreline. That is why the symbol in a question is always matched against the legend first.
- Colour conventions help you guess, and the legend on that particular map confirms the answer, because atlases can use slightly different shades.
- With contour lines, count how many lines you cross first, then multiply by the contour interval.
Find north with the compass rose
The orientation mark, or compass rose, shows north, east, south and west. It is usually drawn as an arrow or star with the letter N, or U on Indonesian-language maps. Direction matters because almost every question about relative position depends on it: which town lies to the north-east, which way a river flows, which island sits furthest south. Once you have found the north arrow, practise the four directions in between: north-east, south-east, south-west and north-west. An easy method is to lay a pencil on the map parallel to the north arrow, then turn it a quarter turn for each main direction and an eighth of a turn for those in between. This is where a digital map helps most. Open a map of your neighbourhood on a phone, treat home as the centre, and name what lies to the north, east, south and west: a school, a market, a place of worship or a main road. Then check against the real view from your front door, for instance by noticing which side the sun rises on in the morning. Phone maps often rotate with the way the phone is held, so locate the north marker before naming any direction. In a printed atlas, do the same for your own town or regency by naming the neighbouring areas in all four directions. Linking map directions to places you actually know makes them far easier to recall in an exam. One note for older maps or wall maps in classrooms: the north arrow is sometimes small and tucked into a corner or beside the legend. Search for it carefully before drawing any conclusion about direction.
- Write a small N in the corner of your notes whenever you redraw a map so the direction is never lost.
- A phone compass can confirm that north on the map matches north outdoors.
Pin down the location with latitude and longitude
Latitude and longitude form a coordinate grid that lets any place on earth be written as a pair of numbers. Latitude measures distance north or south of the equator in degrees. The equator is 0°, the North Pole 90° N and the South Pole 90° S. Longitude measures distance east or west of the prime meridian at 0°, up to 180° on the far side, called the antimeridian. Indonesia's Grade 7 textbook gives the country's astronomical position as between 6° N and 11° S and between 95° E and 141° E. Two things follow from those numbers. The latitude span is 17 degrees, and because one degree of latitude is roughly 111 km, Indonesia stretches about 1,900 km from north to south (17 × 111 = 1,887). The longitude span is 46 degrees, and that figure explains why Indonesia uses more than one time zone. To read coordinates in an atlas, find the two lines of latitude on either side of the place, estimate where it falls between them, and repeat for longitude. Write latitude first, then longitude. One minute of latitude is about 1.8 km and one second about 32 m, so a difference that looks tiny in the numbers can mean a real distance on the ground. For practice, find the coordinates of your home on a digital map and compare them with your town's position in the atlas. Both should fall in the same range of degrees. If they are far apart, a direction letter has usually been swapped. Another frequent mix-up is swapping latitude and longitude. A simple memory aid: latitude lines run flat like the rungs of a ladder and never exceed 90°, while longitude lines run from pole to pole and can reach 180°. Any coordinate above 90 must be longitude.
- In multiple-choice questions, cross out options with the wrong hemisphere (N or S) before comparing numbers.
- Use a ruler to draw a guide line from the point to the nearest lines of latitude and longitude.
Six map and atlas details that are easy to miss
Large scale shows the streets
A 1:10,000 map is detailed enough to show the streets of a single neighbourhood, while a 1:1,000,000 map carries only towns and major rivers. When a question asks which map suits finding a route to school, the answer is the large-scale one, with the small denominator. A phone map zoomed in until lane names appear is showing a very large scale.
Count the contours, then judge the slope
The height difference between two places equals the number of contour lines crossed times the interval printed in the margin. Set that against the horizontal distance worked out from the scale: a big rise over a short distance marks steep terrain. Indonesia's geospatial law calls this element hypsography, and the national topographic map draws it as contour lines and spot heights. Thick labelled lines tell you which way is up.
Estimating the contour interval from scale
Cartography teaching materials use a working rule: contour interval = 1/2,000 × the scale denominator. On a 1:50,000 map that gives 25 m, and on 1:25,000 it gives 12.5 m. The rule is a learning aid, and the interval that applies to a given map is always read from its margin. Smaller intervals reveal small changes in height, so large-scale maps look busier.
Point, line and area symbols
A regency capital is drawn as a point, rivers and railways as lines, lakes and swamps as areas. Recognising the shape of a symbol helps you guess its meaning before checking the legend, and the legend then confirms the guess. On thematic maps, similar-looking symbols can mean different things, so the habit of checking the legend stays useful.
Finding scale from a reference map
If a map has lost its scale, compare it with a map whose scale is known using P2 = (d1/d2) × P1. Say two towns are 4 cm apart on a 1:100,000 map and 2 cm apart on the second map; the second map's scale is 1:200,000. The check is quick: 4 cm × 100,000 and 2 cm × 200,000 both give 400,000 cm, or 4 km.
Time zones come from longitude
The earth turns 360° in 24 hours, so every 15° of longitude equals one hour. Presidential Decree 41 of 1987 set Western Indonesia Time on the 105° E meridian (GMT+7), Central Indonesia Time on 120° E (GMT+8) and Eastern Indonesia Time on 135° E (GMT+9), in force since 1 January 1988. So 07.00 in Jakarta is 09.00 in Jayapura.
The clearest sign that someone can read a map is working out real distance from the scale. The formula: real distance = map distance × scale denominator. Do it first with a ruler on the atlas, then repeat on a digital map: measure the distance from home to school with the distance tool and compare it with your calculation from a printed map at a known scale. The distance tool measures a straight line between two points, so its result is usually shorter than the route along the roads. That gap makes a good discussion point: how many bends does the road take between the two places?
- Scale 1:50,000, map distance 4 cm: 4 × 50,000 = 200,000 cm = 2 km.
- Scale 1:25,000, map distance 6.5 cm: 6.5 × 25,000 = 162,500 cm = 1.625 km.
- Finding the scale: 5 cm on the map stands for 10 km, or 1,000,000 cm, so the scale is 1:200,000.
- A verbal scale of 1 inch to 4 miles means every inch on the ruler covers 4 miles on the ground.
Checklist before answering a map question
- The title has been read, and the area and theme are noted.
- The source and year of the map have been checked.
- The form of the scale is identified: numeric, verbal or graphic.
- Every measurement is converted to centimetres before calculating.
- The symbol in the question has been matched directly against the legend.
- North has been located from the compass rose.
- Coordinates are written in full with N or S and E.
- The distance answer carries a unit, km or m, and is sensible for that area.
- Read a map in a fixed order: title, scale, legend, compass rose, then latitude and longitude.
- Real distance equals map distance times the scale denominator; at 1:50,000, 4 cm equals 2 km.
- A large scale (small denominator) shows a small area in detail, and a small scale shows a wide area.
- Close contour lines are spotted by calculation: lines crossed times the interval gives the height difference, the scale gives the horizontal distance, and a big rise over a short distance means steep terrain.
- One degree of latitude covers about 111 km, and every 15 degrees of longitude equals one hour of time.
- A printed atlas and a digital map of your own neighbourhood work as a pair: calculate on the atlas, then check on the digital map.