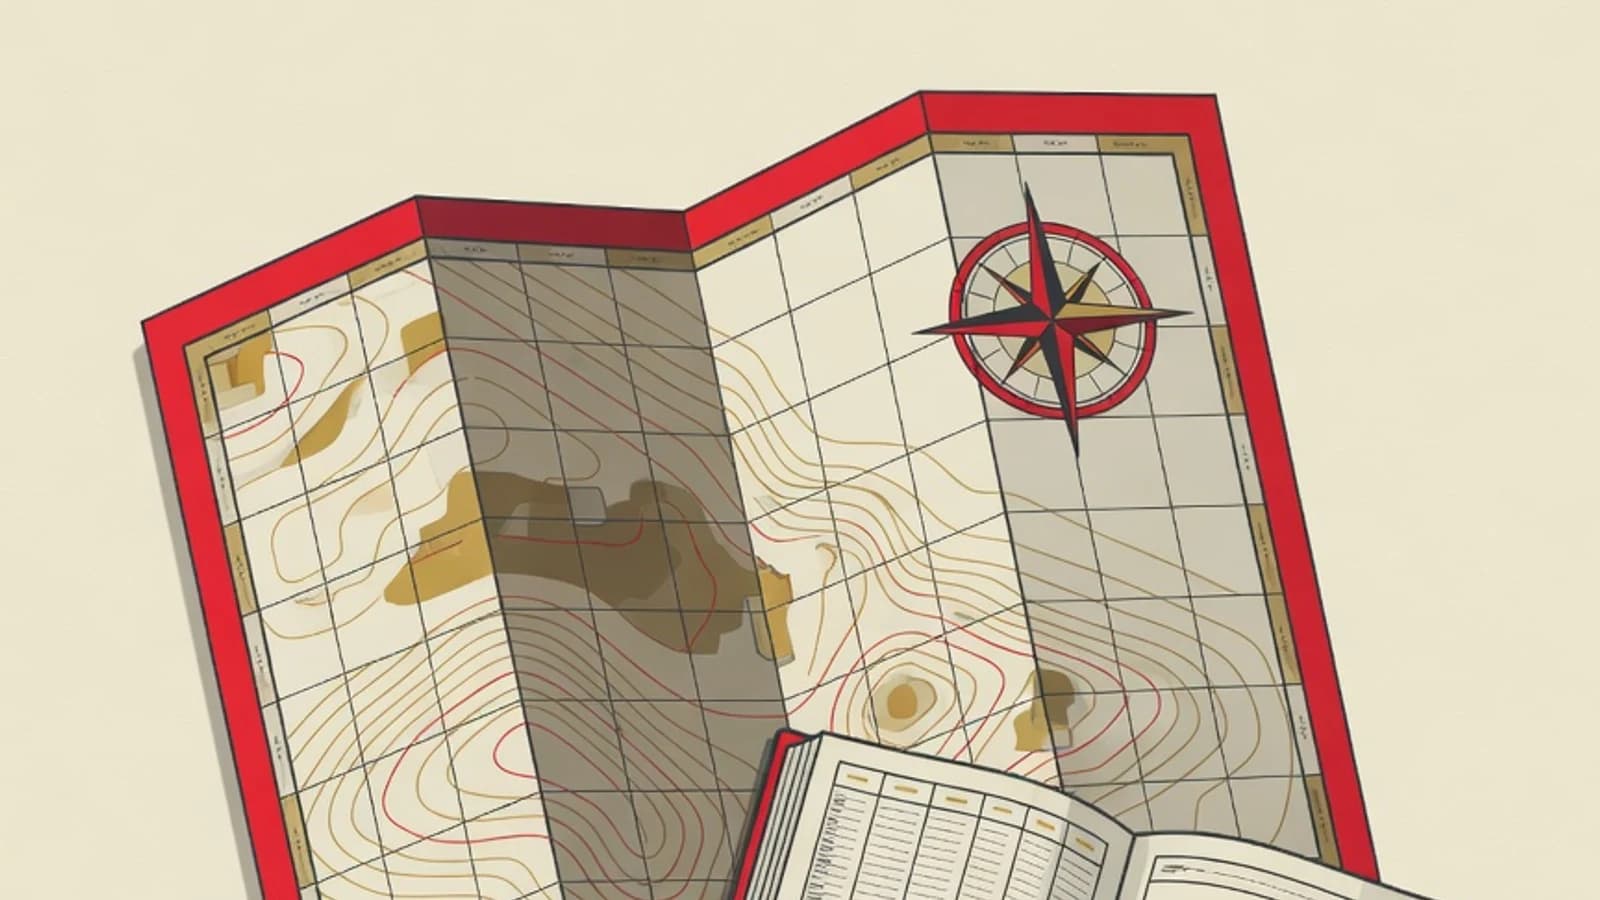
Reading maps and atlases for students starts with the frame: read the title, scale, orientation, and coordinates first, decode the legend, then interpret the content. For an atlas, use the index and gazetteer so a place is found quickly through the page grid coordinate. With this order, any map becomes easy to read.
- Seven map-frame elements are read before interpreting the content
- Scale and legend turn a drawing into distance and meaning
- The atlas index speeds up locating places through the page grid
- A map or atlas in printed or digital form
- A ruler to measure distance on the map
- A small notebook to copy key legend entries and coordinates
Numbers Behind Reading Maps and Atlases
The Map Frame: Seven Elements Read Before the Content
Every good map carries the same frame, and students who read that frame first rarely get lost. The title tells you the region and theme being mapped, so you know what story the map is telling. The scale explains the ratio between distance on paper and distance on the ground, the key to measuring how far two places truly are. Orientation shows which way is north, usually through an arrow or a compass rose, so left and right on the drawing connect to west and east in the real world. Coordinates in the form of latitude and longitude lines give a precise address for every point. The legend acts as a dictionary of symbols: colours, lines, and marks are translated here. The inset adds a small map to enlarge an important area or place the region in a wider context. The source and year of production mark who published it and when the data was recorded, a signal of how current the information is. Reading these seven elements takes under a minute, and the result is a map ready to be interpreted with confidence.
Six Steps to Read a Map from Scratch
The following order works for any map, from the classroom wall map to a map sheet in an exam. Work through it in sequence so no element is missed.
- 1
Read the map title, source, and year
Start from the corner that holds the title. The title states the region and theme, for example a population distribution map of Java or a rainfall map of Sulawesi. Once the theme is clear, look for the source and year note, usually below or along the edge. A climate map recorded ten years ago carries a different value from a recent one, and careful students always check this before drawing conclusions. This opening step saves time because you will not mistake a thematic map for a plain regional one.
Tips- Note the map theme in one sentence before moving on
- Treat a map with no source note as information that needs a second check
- 2
Check the orientation and coordinate system
Find the north arrow or compass rose to confirm direction. Most maps place north at the top, yet special maps sometimes rotate their orientation, so this mark must be checked. Once direction is certain, notice the edge lines that form a grid. Horizontal lines show latitude, vertical lines show longitude. The degree numbers along the edge help you name a city's position with a precise address. This ability matters when a question asks for the coordinate of a point or asks you to compare the location of two regions.
Tips- State a place's position as latitude first, then longitude
- Use the nearest grid line as a reference point for quick reading
- 3
Understand the scale and calculate real distance
Find the scale note, usually a ratio such as 1:50,000 or a graphic bar scale. A scale of 1:50,000 means one centimetre on the map represents fifty thousand centimetres on the ground, which is half a kilometre. To measure distance, place a ruler between two points, note the length in centimetres, then multiply by the scale. If two cities sit 4 centimetres apart at 1:50,000, the real distance is about 2 kilometres. A graphic bar scale is more practical for digital maps that can be zoomed, because the bar adjusts along with the image.
Tips- Convert units to kilometres at the end so the result reads easily
- For winding roads, measure segment by segment then add them up
A scale with a smaller denominator (for example 1:25,000) actually shows a more detailed and narrower area, while a large denominator (1:1,000,000) covers a wide region with little detail. - 4
Decode the legend and symbols
The legend is the dictionary that opens the whole map. Colours often follow a common agreement: blue for water, green for lowlands, yellow to brown for highlands and mountains. A dashed line can mean an administrative boundary, a thick line means a main road, and a dot inside a circle marks a city. Read every mark in the legend, then find its match in the map body. The habit of decoding the legend first lets distribution patterns, such as a mountain chain or a river course, be read straight away without guessing.
Tips- Memorise the basic colour conventions so the eye reads relief quickly
- A symbol not shown in the legend is asked about or checked against standard cartographic conventions
- 5
Read relief through contour lines and colour gradation
On a topographic map, elevation is drawn with contour lines, curved lines that join points of equal height. Closely spaced contours signal a steep slope, while widely spaced contours signal gentle ground. Numbers on the contour lines state the height in metres above sea level. On a general atlas map, relief is more often shown through colour gradation from green to dark brown. Reading relief helps you understand why a river flows in a certain direction and why settlements gather on the plains.
Tips- Contour lines forming a V point towards the river's upstream
- Compare contour spacing to estimate slope steepness
- 6
Interpret patterns by linking the elements
The final step joins every reading into a spatial story. Link relief, water, transport routes, and city distribution to explain the pattern that appears. Large cities lined along a coast or river, roads that avoid mountain ridges, and farmland hugging fertile plains are patterns you can read once the frame is mastered. At this stage the map turns from a still image into a thinking tool, and exam questions on spatial analysis become easier to answer.
Tips- Practise with why questions: why is a city here, why does a river bend
- Write one pattern conclusion each time you finish reading a map
Map Types Students Meet Often
Topographic Map
Shows the shape of the land through contour lines and elevation. Ideal for understanding relief, slope, and river flow.
Atlas Chorographic Map
A wide-area map such as a country or continent inside an atlas. It presents cities, administrative boundaries, and a general view of the landscape.
Rainfall Map
A thematic map that colours regions by annual rainfall. It helps read climate patterns and planting seasons.
Population Distribution Map
Depicts population density through colour gradation or dots. Useful for demographic analysis in geography questions.
Geological Map
Marks rock types and earth structures with special colours. It underpins understanding of resource potential and hazard risk.
General and Thematic Maps: They Are Read Differently
| Aspect | General Map | Thematic Map |
|---|---|---|
| Content focus | The whole region's features | One theme, such as climate or population |
| Reading key | Symbol legend and scale | Colour gradation and value-class notes |
| Example | Topographic map, atlas country map | Rainfall map, geological map |
| Questions answered | Where a feature is and what its shape is | How much there is and how it is distributed |
The steps for reading the frame stay the same for both. The difference lies in reading colour: a thematic map requires you to read the value-class note before drawing conclusions.
The Atlas: Finding Places Through the Index and Gazetteer
An atlas is a neatly arranged collection of maps, and its main strength lies in the index that is often overlooked. The index or gazetteer is an alphabetical list of place names at the back of the atlas. Each name is followed by a page number and a grid code, for example Manado 42 C3. The 42 points to the page, while C3 points to a box on the lettered and numbered grid along that page's edges. To use it, find the place name in the index, open the listed page, then trace the meeting of the letter column and the number row that matches the grid code. This is far faster than scanning the whole page with your eyes. Beyond the index, modern atlases offer world thematic pages, data tables, and regional maps arranged from general to detailed. Students who habitually open the atlas through its index can locate a river, city, or mountain range in seconds, a skill that helps with blind-map questions and mapping assignments alike.
A Checklist for Reading Maps in Exams
- Read the title and theme so you know the map type you face
- Check the north orientation and the coordinate lines along the edge
- Note the scale and prepare a way to measure distance if asked
- Decode the legend and mark the symbols relevant to the question
- For a thematic map, read the colour-class note before concluding
- Link relief, water, and distribution to answer pattern questions
“Students who read the map frame first are always calmer. Title, scale, and legend are mastered within a minute, and the remaining time can go to thinking about patterns. A map stops feeling complex once the reading order becomes a habit.”
- Reading a map starts with seven frame elements before interpreting the content
- Scale turns a drawing into real distance, the legend turns symbols into meaning
- Closely spaced contours mean a steep slope, widely spaced ones mean gentle ground
- The atlas index and gazetteer speed up locating places through the page grid code