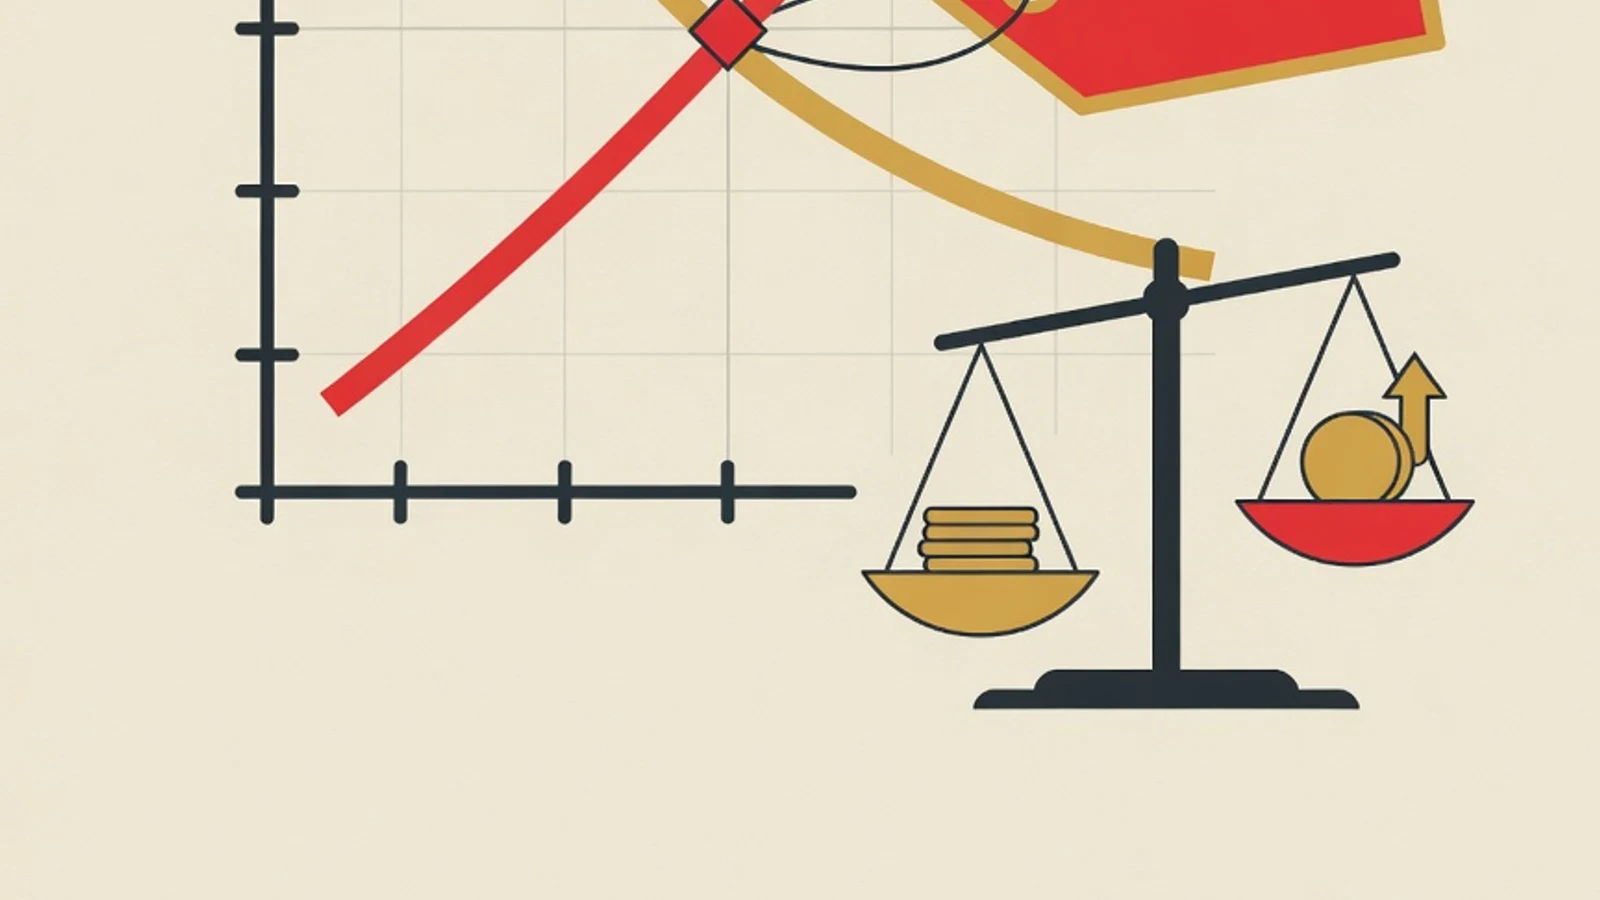
The law of demand states that the quantity buyers want moves in the opposite direction to price, while the law of supply states that the quantity sellers offer moves in the same direction as price. The fastest way to understand the law of supply and demand is to follow the price logic, draw the curves, then read where the two meet.
- Law of demand: price up, quantity demanded down (inverse relationship)
- Law of supply: price up, quantity supplied up (direct relationship)
- Equilibrium appears where the demand and supply curves intersect
- Grade 10 economics textbook (Merdeka Curriculum, phase E)
- Graph paper or millimeter block for drawing curves
- Everyday price data, for example chili or rice
The law of supply and demand in numbers
What is the law of supply and demand?
The law of supply and demand is the basic rule that explains how the price of a good forms in a market. The law of demand reads: when the price of a good rises, the quantity buyers want tends to fall, and when the price drops, the quantity demanded rises. The direction is opposite. The law of supply moves the other way: when the price rises, sellers are encouraged to offer more goods, and when the price falls, the quantity supplied shrinks. Its direction follows price. Both laws hold under the ceteris paribus assumption, meaning factors other than price are held constant. From the meeting of buyer and seller behavior, the market settles on a single price that balances the two. Understanding the law of supply and demand means getting comfortable reading the cause and effect between price and quantity, then drawing it as a curve.
How to understand the law of supply and demand step by step
The five steps below take you from price logic to reading the market equilibrium point. Work through them in order, and repeat with a different good so the pattern becomes familiar.
- 1
Grasp the law of demand through everyday experience
Start from events you already know. When the price of chili spikes before a holiday, families tend to buy less of it or look for substitutes. When the price falls, people buy more. This simple pattern is the law of demand: price and the quantity demanded move in opposite directions. Write down three goods around you and observe how the willingness to buy shifts as the price rises or falls. By linking the law of demand to real experience, the formulas and curves that follow will feel sensible, because you already hold the logic first.
Tips- Choose goods whose prices change often so the pattern is easy to see
- Note the reason behind each shift in willingness to buy, together with its context
- 2
Flip the perspective to understand the law of supply
Now stand in the seller's or producer's position. When the selling price of a good is high, producers earn a larger profit, so they are encouraged to make and offer more. When the price is low, some producers cut production because the margin thins. That is the law of supply: price and the quantity supplied move in the same direction. Take the same good you used for demand, then write down how sellers react at each price level. Getting used to seeing the market from both sides, buyer and seller, is the key to understanding the law of supply and demand as a whole.
Tips- Picture yourself as a shop owner deciding how much stock to buy
- Connect production decisions to cost and profit, staying beyond price alone
- 3
Build a table of price and quantity for both sides
Turn your verbal understanding into numbers. Make a table with a price column, then fill in the quantity demanded and the quantity supplied at each price level. For example, at a price of Rp10,000 the quantity demanded is 20 units and quantity supplied is 5 units, while at Rp30,000 the quantity demanded is 8 units and quantity supplied is 18 units. A table like this is called a demand and supply schedule. Watch the direction of the figures: the demand column falls as price rises, the supply column climbs. The table becomes a bridge before you move the data onto a graph, and it helps you see at which price the two figures begin to converge.
Tips- Use five price levels so the falling and rising patterns read clearly
- Give the demand and supply columns different colors
- 4
Draw the demand and supply curves on one graph
Move the figures from the table onto a coordinate plane. Place price on the vertical axis and quantity on the horizontal axis. Plot the demand points, then join them into a curve that slopes down from top left to bottom right. Plot the supply points, then join them into a curve that climbs from bottom left to top right. The demand curve has a negative slope, the supply curve a positive slope. Drawing both on the same graph makes the market mechanism visible, and it prepares you to find their meeting point in the next step.
Tips- Use graph paper so the axis scale stays consistent
- Label the vertical axis P (price) and the horizontal axis Q (quantity)
Many students mistakenly place quantity on the vertical axis. The economic convention always puts price on the vertical axis and quantity on the horizontal axis. - 5
Locate and read the market equilibrium point
The intersection of the demand curve and the supply curve is the equilibrium point. At that point, the quantity demanded exactly equals the quantity supplied. The price there is called the equilibrium price, and the quantity is called the equilibrium quantity. To find it algebraically, set the demand function equal to the supply function (Qd = Qs), solve for the price, then substitute it back to get the quantity. Read this point as the market's agreement: the price at which the buyer's willingness and the seller's readiness meet. Mastering the reading of the equilibrium point signals that you fully understand the law of supply and demand.
Tips- Verify the algebra by looking at the intersection on the graph
- Practice with different functions until the steps feel automatic
Comparing the law of demand and the law of supply
| Aspect | Law of Demand | Law of Supply |
|---|---|---|
| Main actor | Buyers or consumers | Sellers or producers |
| Price relationship | Opposite direction | Same direction |
| When price rises | Quantity demanded falls | Quantity supplied rises |
| Curve shape | Slopes down (negative slope) | Climbs up (positive slope) |
| General function | Qd = a − bP | Qs = a + bP |
Both laws hold under the ceteris paribus assumption, meaning factors other than price are held constant.
Factors that shift the demand and supply curves
Consumer income
A rise in income usually raises the demand for normal goods, shifting the demand curve to the right.
Tastes and trends
A change in public interest toward a good can add to or reduce demand at every price level.
Prices of other goods
The prices of substitutes and complements shift demand, such as coffee against tea or a phone against its case.
Production cost
Rising raw-material and wage costs lower supply, shifting the supply curve to the left.
Production technology
More efficient technology increases a producer's ability to offer goods, shifting the supply curve to the right.
Taxes and subsidies
Taxes push supply down while subsidies push it up, since both change the cost producers bear.
“The supply and demand curves are simply a picture of a bargaining conversation. Once students get used to translating a price story into lines, the equilibrium point stops feeling abstract and starts reading like a reasonable conclusion.”
Memorizing formulas or understanding curve logic
- Able to answer word problems and new cases never seen before
- Easy to explain why prices move, down to the reason behind them
- Understanding lasts and connects to the elasticity material
- Prone to confusion when the numbers in a problem change
- Hard to tell a movement from a shift of the curve
- Quickly forgotten because no logic supports it
Checklist for mastering the law of supply and demand
- Can explain the law of demand and the law of supply in your own words
- Able to build a price-and-quantity schedule for buyers and sellers
- Draw the curves with price on the vertical axis and quantity on the horizontal axis
- Find the equilibrium point through both the graph and algebra
- Distinguish a movement along the curve from a shift of the curve
- The law of demand moves opposite to price, the law of supply moves in the same direction as price.
- The demand curve slopes down and the supply curve climbs up on the same graph.
- The equilibrium point is where the two curves meet, where quantity demanded equals quantity supplied.
- Telling a movement along the curve apart from a shift of the curve prevents the most common confusion.