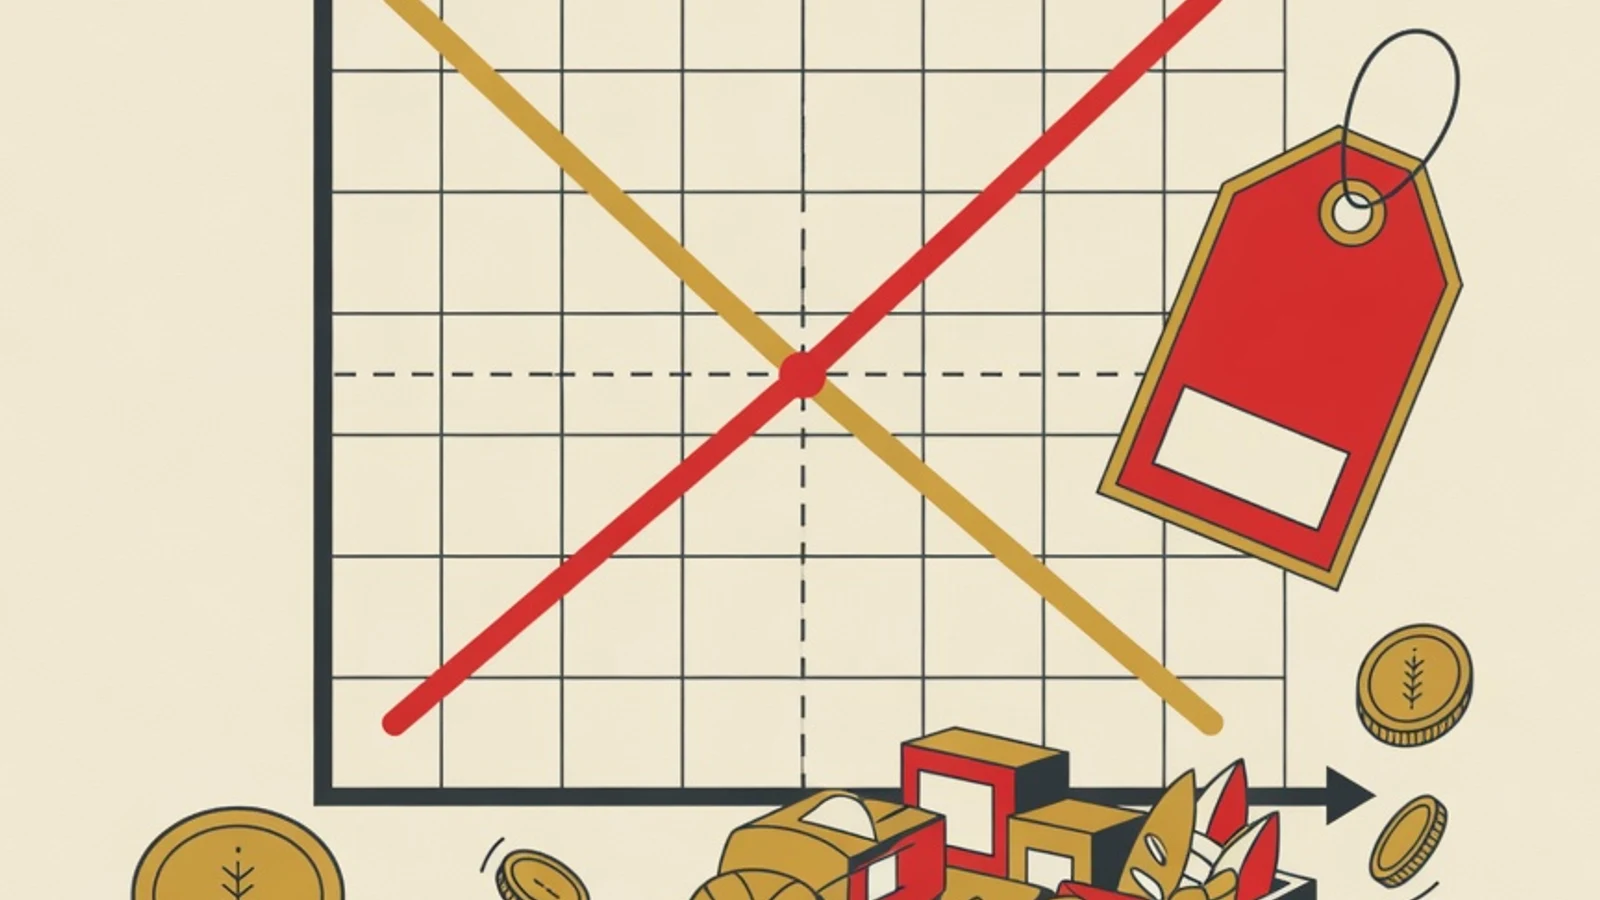
Understanding microeconomics for high school starts with the behavior of a single economic unit: one consumer, one firm, and one market. Master the laws of demand and supply first, read market equilibrium, then move on to elasticity and market structures. The five steps in this guide arrange the entire grade 10 microeconomics syllabus in sequence.
- Microeconomics centers on the choices of one consumer and one producer within a single market
- The laws of demand and supply form the foundation of all high school micro analysis
- Market structures and elasticity are the topics that appear most often in exams
- Grade 10 (Phase E) economics textbook
- Graph paper for demand and supply curves
- A simple calculator for elasticity computations
High school microeconomics in numbers
What microeconomics means in high school lessons
Microeconomics is the branch of economics that observes how the smallest economic agents decide when resources are limited. In grade 10 Phase E, the broad theme is human beings and their efforts to meet needs, so the discussion moves from diverse needs toward the choices that must be made. Every microeconomics topic revolves around three figures: the consumer who decides how much to buy, the producer who decides how much to sell, and the market that brings them together through price. When you read a question about rising chili prices or concert tickets selling out quickly, you are reading microeconomics. Strong understanding grows when you can link a formula to an everyday event around you.
Five steps to understand microeconomics for high school
Order your understanding to follow the flow of grade 10 material so that each concept stands on a foundation that is already solid.
- 1
Start from scarcity and choice
Scarcity is the starting point of all microeconomics. Human needs are vast while the means to satisfy them are limited, so every person is compelled to choose. Train yourself to recognize opportunity cost, the value of the best option you give up when you make a decision. A simple example: a hundred thousand rupiah of pocket money can buy a book or an internet data plan, and choosing the book means giving up the data. Build a small table with three daily decisions and write down what you sacrifice with each choice. This habit trains you to think economically before you reach the formulas. Once opportunity cost feels natural, the next topics become far easier to absorb because everything is rooted in the idea of choosing amid limits.
Tips- Write the opportunity cost of three decisions you made today
- Distinguish primary, secondary, and tertiary needs from your own spending
- 2
Master the laws of demand and supply
The law of demand states that when the price of a good rises, the quantity consumers demand tends to fall, holding other factors constant. The law of supply moves in the opposite direction: when price rises, the quantity producers offer tends to increase because the profit opportunity grows. These two laws are the main engine of micro analysis. Master first the difference between movement along the curve, caused by a change in the good's own price, and a shift of the curve, caused by other factors such as taste, income, or the price of substitutes. Draw the price axis vertically and the quantity axis horizontally, then sketch a downward demand curve and an upward supply curve. Repeat drawing from simple tables until the shape sticks in your memory without an example.
Tips- Memorize the direction: demand slopes down, supply slopes up
- Separate factors that shift the curve from factors that only move a point along it
Many students confuse a shift of the curve with movement along the curve. Make sure this concept is clear before moving on. - 3
Read market equilibrium from curves and tables
Market equilibrium forms at the point where the demand curve and the supply curve intersect, that is, when the quantity demanded exactly equals the quantity supplied. At that point there is neither a surplus nor a shortage of goods. Practice finding the equilibrium point in two ways: reading the intersection on a graph and solving the demand and supply functions algebraically. Take a demand function Qd equals a number minus price, and a supply function Qs equals a number plus price, then set them equal to find the equilibrium price. Once you have the price, substitute it back into either function to obtain the equilibrium quantity. This exercise links the picture to the arithmetic, so you are ready for both graph questions and numerical questions in the exam.
Tips- Set Qd equal to Qs to find the equilibrium price
- Check your answer by substituting the price into the original function
- 4
Practice the concept of elasticity
Elasticity measures how responsive the quantity of a good is to a change in price. Demand is called elastic when a small price change triggers a large change in quantity, and inelastic when quantity barely moves even as price shifts. Fuel and rice are often used as examples of inelastic goods because people still need them even when prices rise, while luxury goods tend to be elastic. Compute the elasticity coefficient by comparing the percentage change in quantity to the percentage change in price. A value greater than one means elastic, less than one means inelastic, and exactly one means unit elasticity. Work through several practice problems with before and after prices, then interpret the result in everyday sentences so the concept truly sticks and does not stop at the formula.
Tips- Remember the thresholds: above one is elastic, below one is inelastic
- Tie each value to a real good in the market
- 5
Map out market structures
Market structure explains how the number of sellers and the nature of goods shape the way price is formed. Grade 10 dissects four forms: perfect competition with many sellers and identical goods, monopoly with one seller and no close substitutes, oligopoly with a few large sellers, and monopolistic competition with many sellers whose goods differ slightly. Build a table comparing the number of sellers, the type of goods, and control over price in each form of market. Link every form to an Indonesian example you know, such as rice in a market close to perfect competition and regional water services in a monopoly. With a table and examples, you can answer comparison questions quickly because the pattern is already clear in your mind.
Tips- Compare structures across three columns: number of sellers, type of goods, price control
- Pair each structure with one Indonesian example you recognize
Key concepts that must stick
Opportunity cost
The value of the best option given up when you choose one option. It is the basic way of thinking behind all microeconomics.
Ceteris paribus
The assumption that other factors are held constant. Used to isolate the effect of one variable, such as price, on quantity.
Marginal utility
The added satisfaction from consuming one more unit of a good. Its value tends to fall as consumption grows.
Consumer surplus
The gap between the price a consumer is willing to pay and the actual market price paid.
Substitute goods
Goods that replace one another, such as tea and coffee. A price change in one affects demand for the other.
Price elasticity
A measure of how responsive quantity is to a price change, stated as a numerical coefficient.
Four market structures in one table
| Feature | Perfect Competition | Monopoly | Oligopoly |
|---|---|---|---|
| Number of sellers | Very many | One | A few large |
| Type of goods | Identical | No close substitute | Homogeneous or slightly differentiated |
| Price control | Follows the market | Price setter | Mutually influencing |
| Barriers to entry | Low | Very high | Fairly high |
Monopolistic competition sits between perfect competition and oligopoly, with many sellers whose goods differ slightly.
“Students who understand microeconomics usually keep connecting a curve to the prices in the market near their home. Memorizing formulas then follows on its own. Once a curve has a story, graph questions feel light.”
Microeconomics readiness checklist
- Can explain opportunity cost from an everyday decision
- Can draw demand and supply curves from a table
- Can find market equilibrium from a graph and from functions
- Can compute and interpret the elasticity coefficient
- Can distinguish four market structures with examples
- Can tell a movement along the curve from a shift of the curve
- Microeconomics focuses on the decisions of consumers, producers, and markets amid limited resources
- The laws of demand and supply are the foundation supporting all grade 10 micro analysis
- Market equilibrium, elasticity, and market structures are the most frequently tested topics
- Linking a curve to real market prices makes concepts far easier to remember