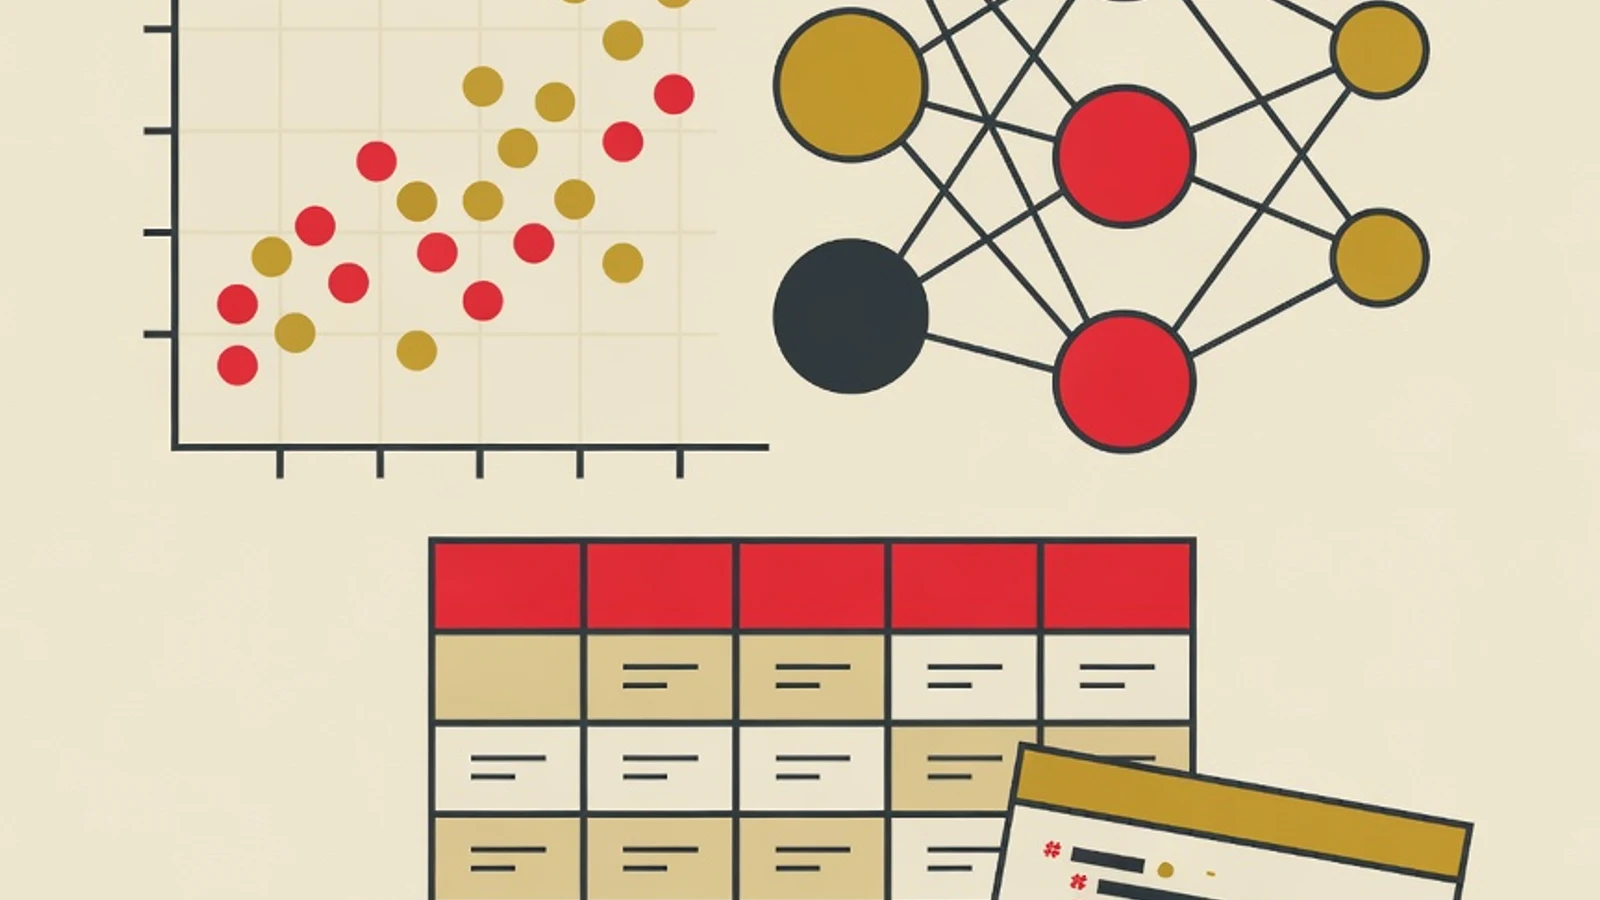
A data science learning roadmap from scratch begins with statistics and math foundations, moves on to mastering Python, pandas, and SQL, then data exploration, machine learning with scikit-learn, and finally weaving it all into an end-to-end project. These seven stages take roughly eight to twelve months with regular, staged practice.
- Statistics and probability form the foundation, since data science rests on reasoning with numbers
- Python with pandas, NumPy, and scikit-learn becomes your main toolkit along the whole path
- It ends in one end-to-end project, from raw data all the way to a model you can test
- A laptop with at least 8 GB of RAM and a stable internet connection to run notebooks
- A free GitHub account to store your code and staged projects
- A notebook or document to summarize statistics formulas and the gist of each topic
- A fixed practice schedule, around 8 to 10 hours spread across the week
Why Data Science Is Worth Learning Right Now
Understand First What Data Science Is and How It Differs From Data Analyst
Many beginners equate data science with building attractive dashboards. The core of data science sits in a deeper layer: using statistics and machine learning to model patterns, test hypotheses, and make predictions from data. A data analyst generally explains what has already happened through reports and visualizations. A data scientist steps into the next question, estimating what will happen and why, then building a model that can be tested again. Because of that, the data science learning path demands two equally strong legs. The first leg is statistical reasoning: understanding how data is distributed, probability, and how to judge whether a pattern is meaningful or merely coincidence. The second leg is programming: writing clean Python code to handle large volumes of data. The roadmap below lays out an orderly sequence, so you build the numeric foundation first before jumping into complicated models.
Seven Stages of Learning Data Science From Scratch
Take them in order. Each stage stacks on the one before it, and each stage leaves one real result that will later fill your portfolio.
- 1
Stage 1: Build a Statistics and Math Foundation
Begin with reasoning about numbers, since every model later leans on it. Learn descriptive statistics like mean, median, and standard deviation, then move to probability and common data distributions such as the normal distribution. Get to know simple hypothesis testing to judge whether a difference is meaningful or arises by chance. On the math side, it is enough to understand basic linear algebra such as vectors and matrices, along with the idea of slope that sits at the heart of gradient descent. You do not need to be a math expert to begin. What matters is grasping the meaning behind each number, since this understanding separates someone who uses a model blindly from someone who uses it with awareness. Set aside six to eight weeks to build this foundation while working through small problems.
Tips- Tie each statistical concept to a real example, such as the spread of exam scores in one class
- Work problems by hand first before handing them to the computer, so the meaning of the formula sticks
- 2
Stage 2: Master Python for Data Science
Python is the main data science language because its syntax is clean and its library ecosystem is complete. Learn the basics of the language first: data types, loops, conditionals, functions, and structures like lists and dictionaries. Once comfortable, get to know NumPy for numerical computation with arrays, then pandas for handling data tables in the form of dataframes. Do everything in Jupyter Notebook or Google Colab so your code and its results appear side by side. An effective practice at this stage is loading one CSV file, filtering rows, computing summaries per group, and adding new columns. These everyday activities are exactly what you will repeat in every later project. Give it eight to ten weeks until your hands move nimbly writing data-processing code.
Tips- Google Colab runs in the browser with no installation needed, a quick way to get started
- Get into the habit of naming variables clearly and writing code you can reread with ease tomorrow
- 3
Stage 3: Master SQL and Data Retrieval
Real data rarely arrives in tidy files. Most of it lives in databases, and SQL is the language for pulling it out. Learn the core commands like SELECT, WHERE, GROUP BY, and JOIN for combining several tables. This skill lets you independently pull the data you need before analyzing it. Practice with a sample database, write queries that answer concrete questions, for example computing the average transaction per city. At this stage, also get used to joining the SQL and pandas flow: pull raw data with SQL, then process it further in Python. Combining the two is a data scientist's daily way of working. Set aside three to four weeks to build a solid grasp of SQL basics.
Tips- Build queries gradually, testing each piece before adding the next clause
- Understand the difference between JOIN types early, since a mistake here quietly doubles rows
- 4
Stage 4: Practice Data Exploration and Visualization
Before training a model, get to know its character through exploratory data analysis. At this stage you check data quality: hunting for missing values, spotting outliers, and understanding the spread of each column. Visualization is the main tool. Use matplotlib and seaborn to make histograms, scatter plots, and correlation heatmaps. The right chart often reveals patterns invisible in a table of numbers. This part connects directly to data cleaning, meaning handling empty values, standardizing formats, and preparing columns so they are fit for modeling. Recall the industry figure that the largest share of a data scientist's time is spent right here. The patience to prepare clean data pays off with a model that is far more trustworthy.
Tips- Start exploration by asking questions of the data, such as which column relates most to the target
- Record every cleaning decision so your process can be repeated and reviewed
Skipping the exploration stage and training a model straight away leaves you easily fooled by dirty data, so the result looks good on screen yet stays fragile when tested again. - 5
Stage 5: Learn Machine Learning With scikit-learn
This is the heart of data science. Machine learning lets a computer learn patterns from data to make predictions. Start with supervised learning through two basic cases: regression to estimate numbers and classification to sort categories. Get to know introductory algorithms such as linear regression, logistic regression, decision trees, and random forests. scikit-learn provides them all through a uniform pattern, fit to train and predict to predict, so you can focus on understanding. Train your first model on a classic dataset, for example estimating house prices from area and location. The key at this stage is separating training data from test data, so you judge the model on data it has never seen. Give it eight to ten weeks to get to know a few core algorithms.
Tips- Master one algorithm until you understand how it works before jumping to the next
- Always split training and test data from the start, this habit saves you from false conclusions
- 6
Stage 6: Deepen Model Evaluation and Feature Engineering
Training a model is only half the story. The other half is judging how well the model works and improving it. Learn the right metric for the case: accuracy, precision, and recall for classification, along with RMSE and R squared for regression. Get to know cross-validation to test a model more fairly, and understand overfitting, the state where a model memorizes the training data yet fails on new data. On the other side, feature engineering often gives the biggest jump in quality, for example creating a new column from a date or combining two related variables. If you are interested, peek at the basics of deep learning as a gateway to neural networks. This stage turns you from someone who merely runs a model into someone who understands and improves it. Set aside six to eight weeks to go deeper.
Tips- Pick a metric that fits the context, since accuracy can mislead on imbalanced data
- Compare a simple model with a complex one, often the simple one is enough and easier to explain
Chasing high accuracy without checking for overfitting produces a model that looks great on training data yet disappoints the moment it meets real data. - 7
Stage 7: Assemble It Into an End-to-End Project and Portfolio
The final stage unites all those skills into one complete project. Pick a real problem you understand, for example estimating the number of library book loans or sorting product reviews into positive and negative. Work it from top to bottom: pull the data with SQL or a file, clean and explore it, train a few models, evaluate, then conclude your findings. Document the process in an orderly notebook and upload it to GitHub with a clear README. One deep end-to-end project shows how you think from raw data to a decision, and this is the strongest evidence when applying for a junior role. Tell the story of your reasoning behind each decision along the way, alongside the final result.
Tips- Pick a problem whose data is available and whose context you understand, so your analysis is sharper
- Write a README that explains the problem, data, method, and findings in language easy to follow
Time Estimate for Each Stage for Beginners
Statistics & Python Foundation
Building statistical reasoning, mastering Python, pandas, NumPy, and SQL to pull and process data. Roughly four to five months of regular practice.
Exploration & Machine Learning
Data exploration, visualization, cleaning, then training your first model with scikit-learn. Around three to four months.
Evaluation & Project
Going deeper into metrics, feature engineering, then assembling one end-to-end project for a portfolio. Roughly two to three months.
Three Paths to Learning Data Science and How They Differ
| Path | Strengths | What You Need to Prepare |
|---|---|---|
| Self-taught | Free or cheap, flexible pace | Easy to get lost on the order, without code and concept feedback |
| Intensive bootcamp | Fast and structured | Large cost, a dense pace hard to follow while working |
| Private lessons with one mentor | Clear path, code and models corrected directly | Requires the discipline to attend, schedule agreed with the mentor |
Many beginners combine self-study for Python basics with mentor guidance once they enter the more challenging territory of statistics and machine learning.
“The beginners who mature fastest are the ones brave enough to finish one whole project from dirty data to a conclusion, even if the result is simple. Collecting dozens of tutorials without a single finished project only delays real understanding.”
Checklist Before Calling Yourself Ready to Apply
- Nimble at processing data with pandas and pulling it with SQL with little guesswork
- Understand the meaning of basic statistics and can read the spread and correlation of data
- Have trained a few models with scikit-learn and evaluated them with the right metrics
- Understand overfitting and how to separate training and test data
- Own at least one end-to-end project documented neatly on GitHub
How Much Does Learning Data Science at EduPoint Cost
The guided learning path stays affordable. Data science lessons at EduPoint start from Rp 110,000 per session for online lessons, and from Rp 140,000 per session for in-person. A small group of two to three students is also available from Rp 95,000 per student. The final price adjusts to your learning goal, location, and lesson format. For beginners who want to travel the roadmap above with guidance, the regular package helps you learn consistently each week until your statistics and Python foundation is solid, while the advanced package steers you until you train models and assemble an end-to-end project. The mentor adjusts the emphasis to your starting point, so your study time goes to the part you need most.
- Learning data science from scratch runs from statistics, Python, and SQL foundations, then data exploration, machine learning, evaluation, and a project
- Statistics and programming are two pillars that must both be built from the start
- Data exploration and cleaning consume the largest share of time, and patience here decides model quality
- scikit-learn with its fit and predict pattern lets beginners focus on understanding how a model works
- One end-to-end project documented on GitHub is the strongest evidence when applying for a junior data science role